Visualizing Metrics
etalon logs all the metrics to wandb. You can visualize these metrics using wandb dashboard. Check Setup Wandb [Optional] to setup wandb and Specifying wandb args [Optional] to log metrics to wandb.
To visualize the metrics, follow the steps below:
Go to wandb dashboard at
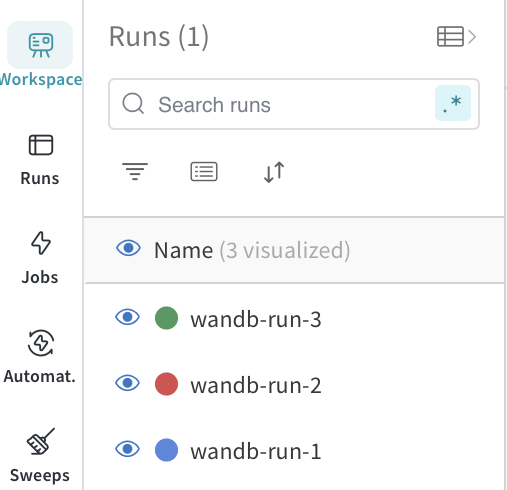
https://wandb.ai/<your-org>/<your-project>.Select the runs you want to visualize in Workspace tab.
Go to any charts section you want to visualize.
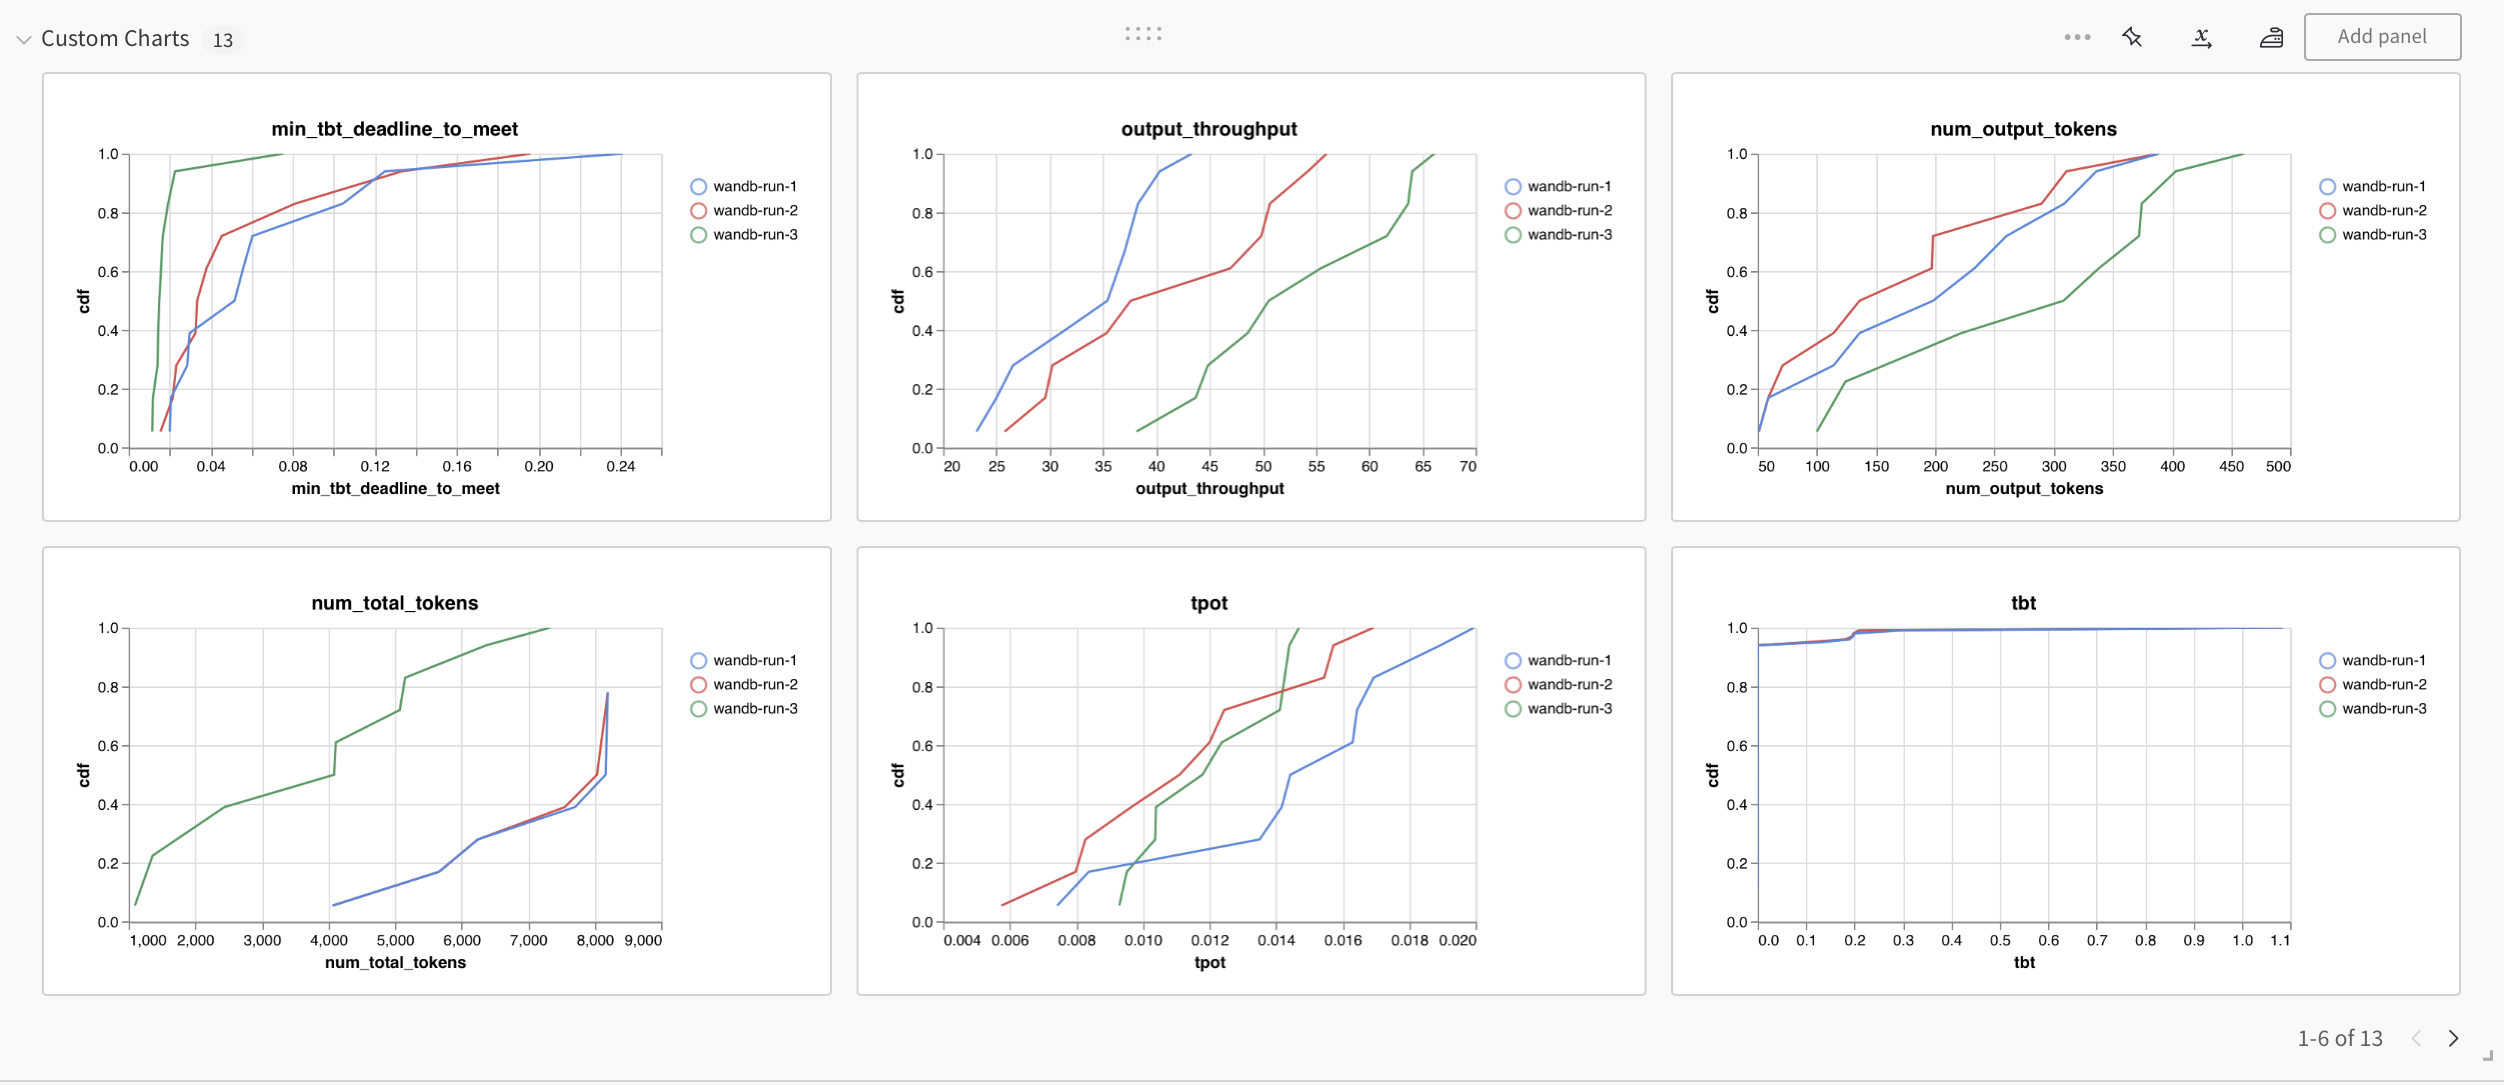
Select the chart from the set of available charts in a given charts section.
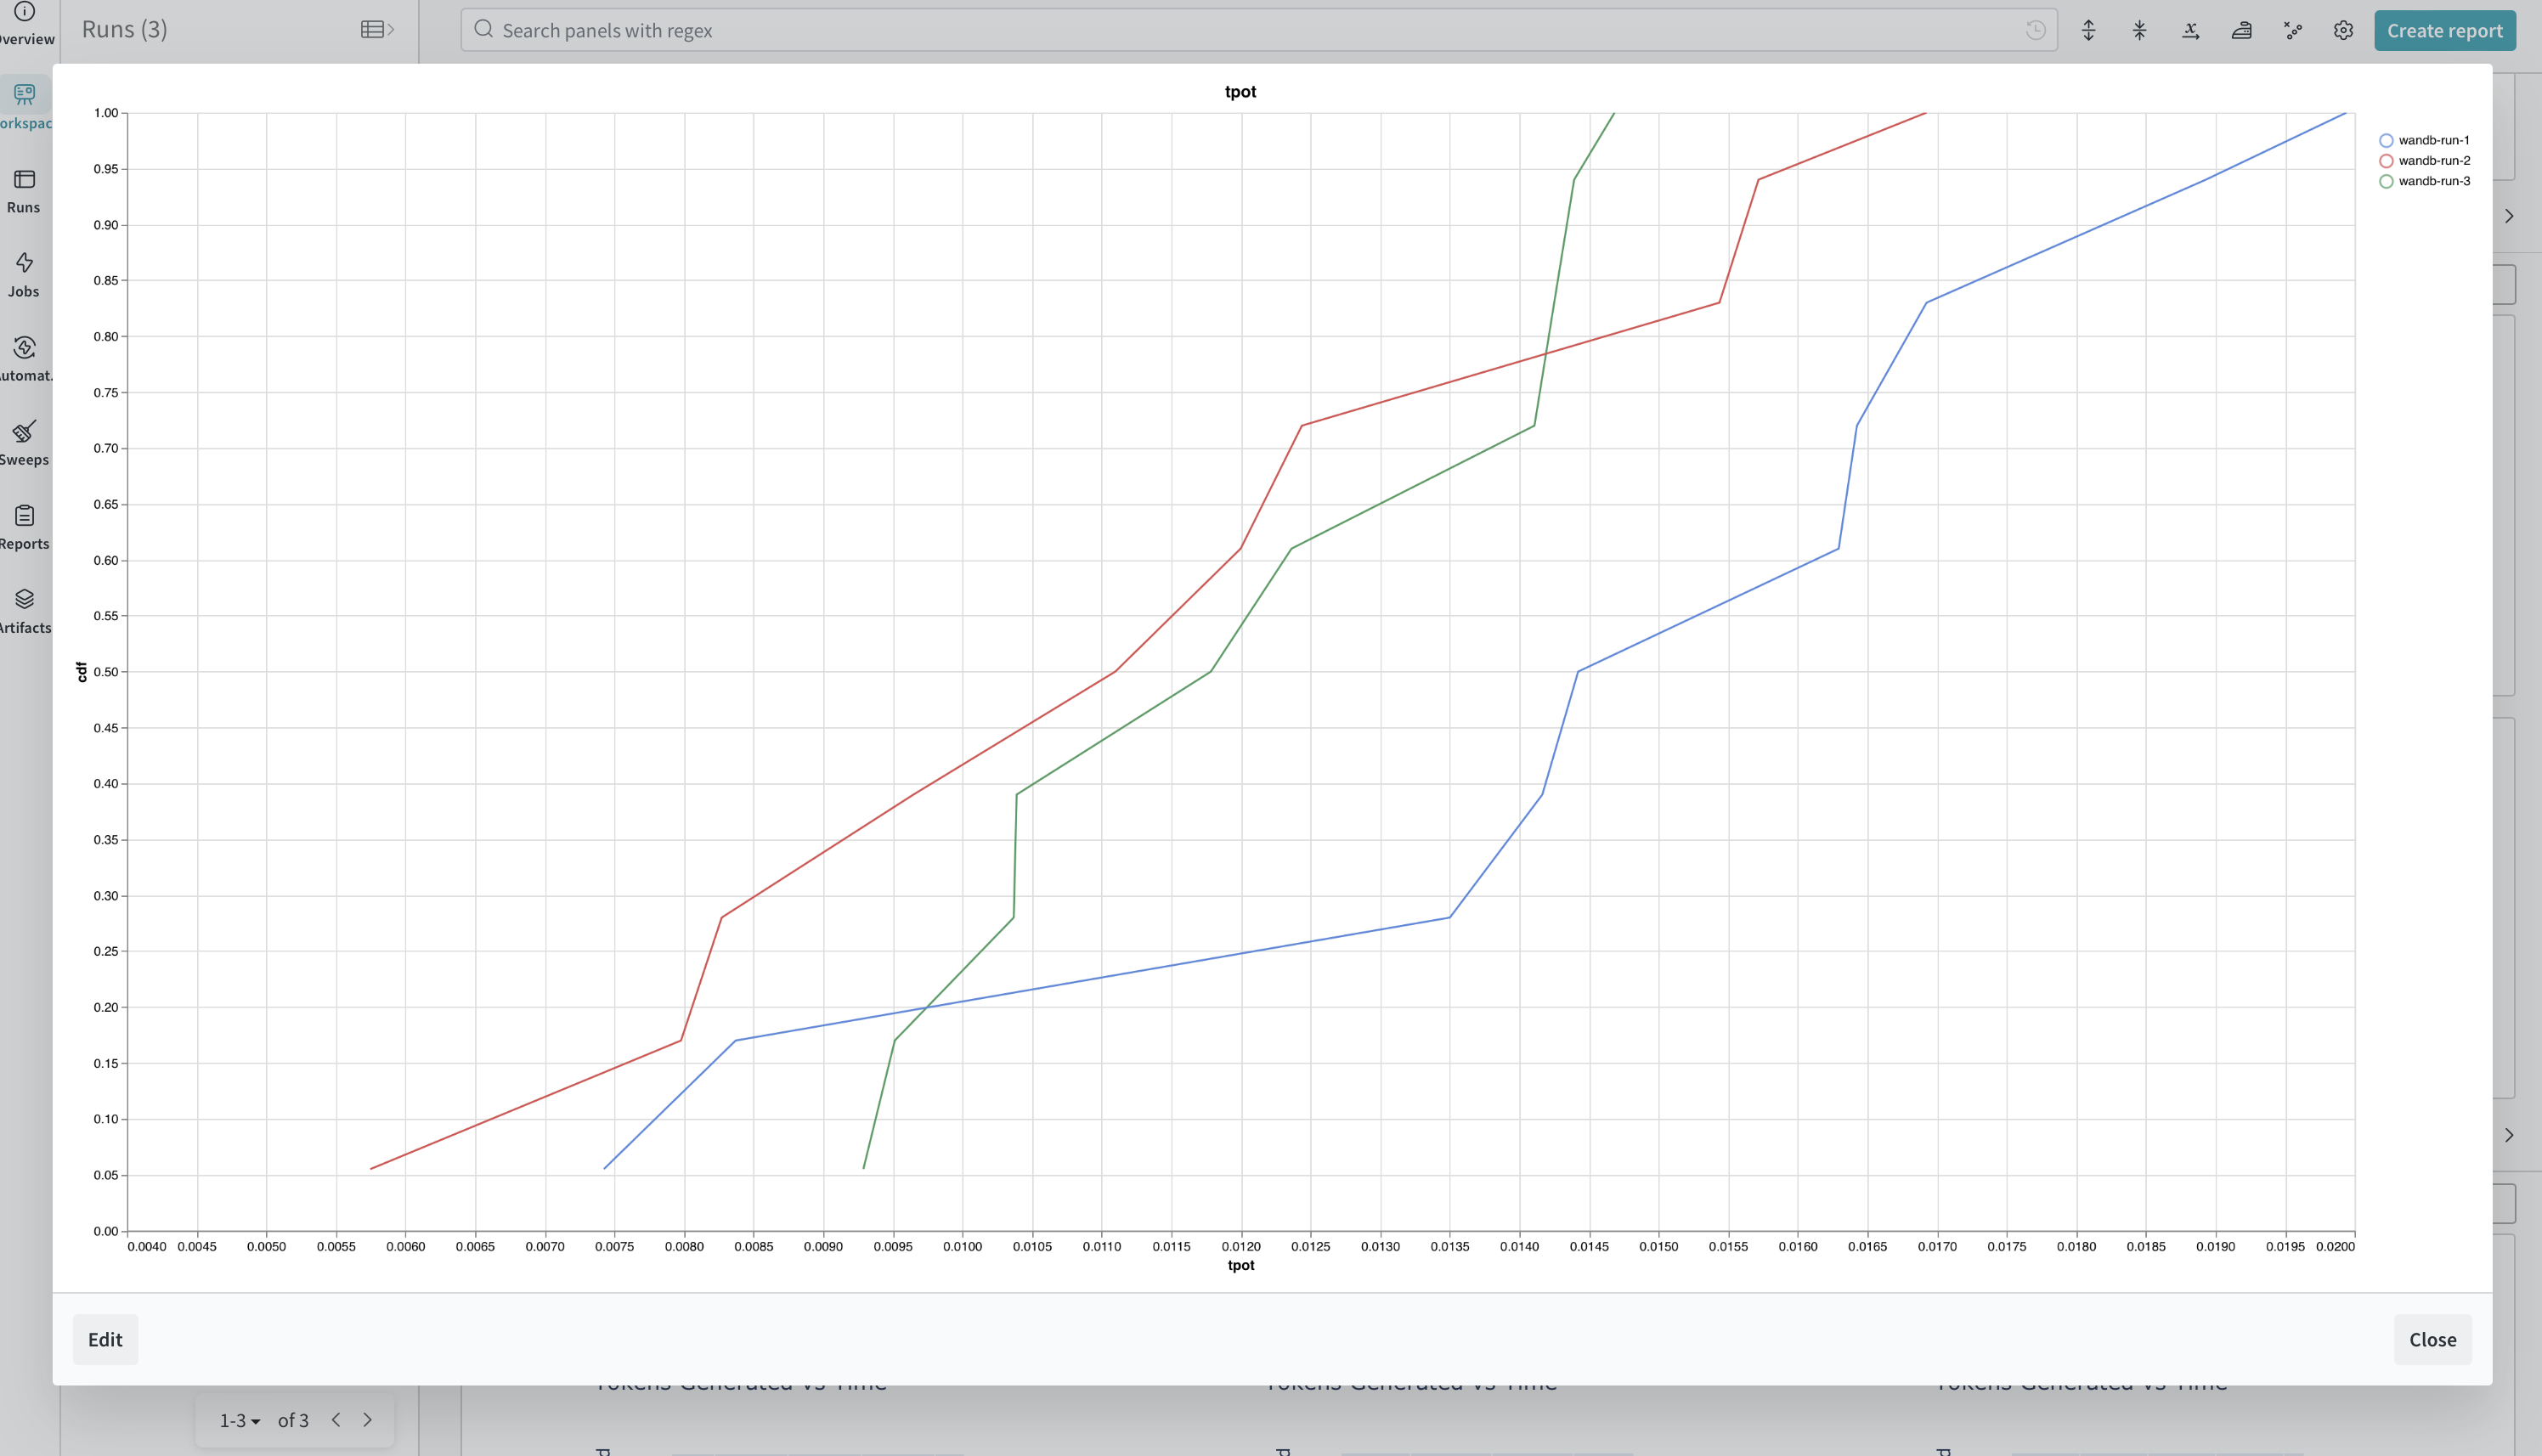
You can also customize the chart based on your requirements on wandb.