Black-box Evaluation
etalon performs black-box evaluation of both proprietary and open-source systems.
Check out the following resources to learn how to run etalon with both proprietary and open-source systems:
Following figures show evaluations by etalon:
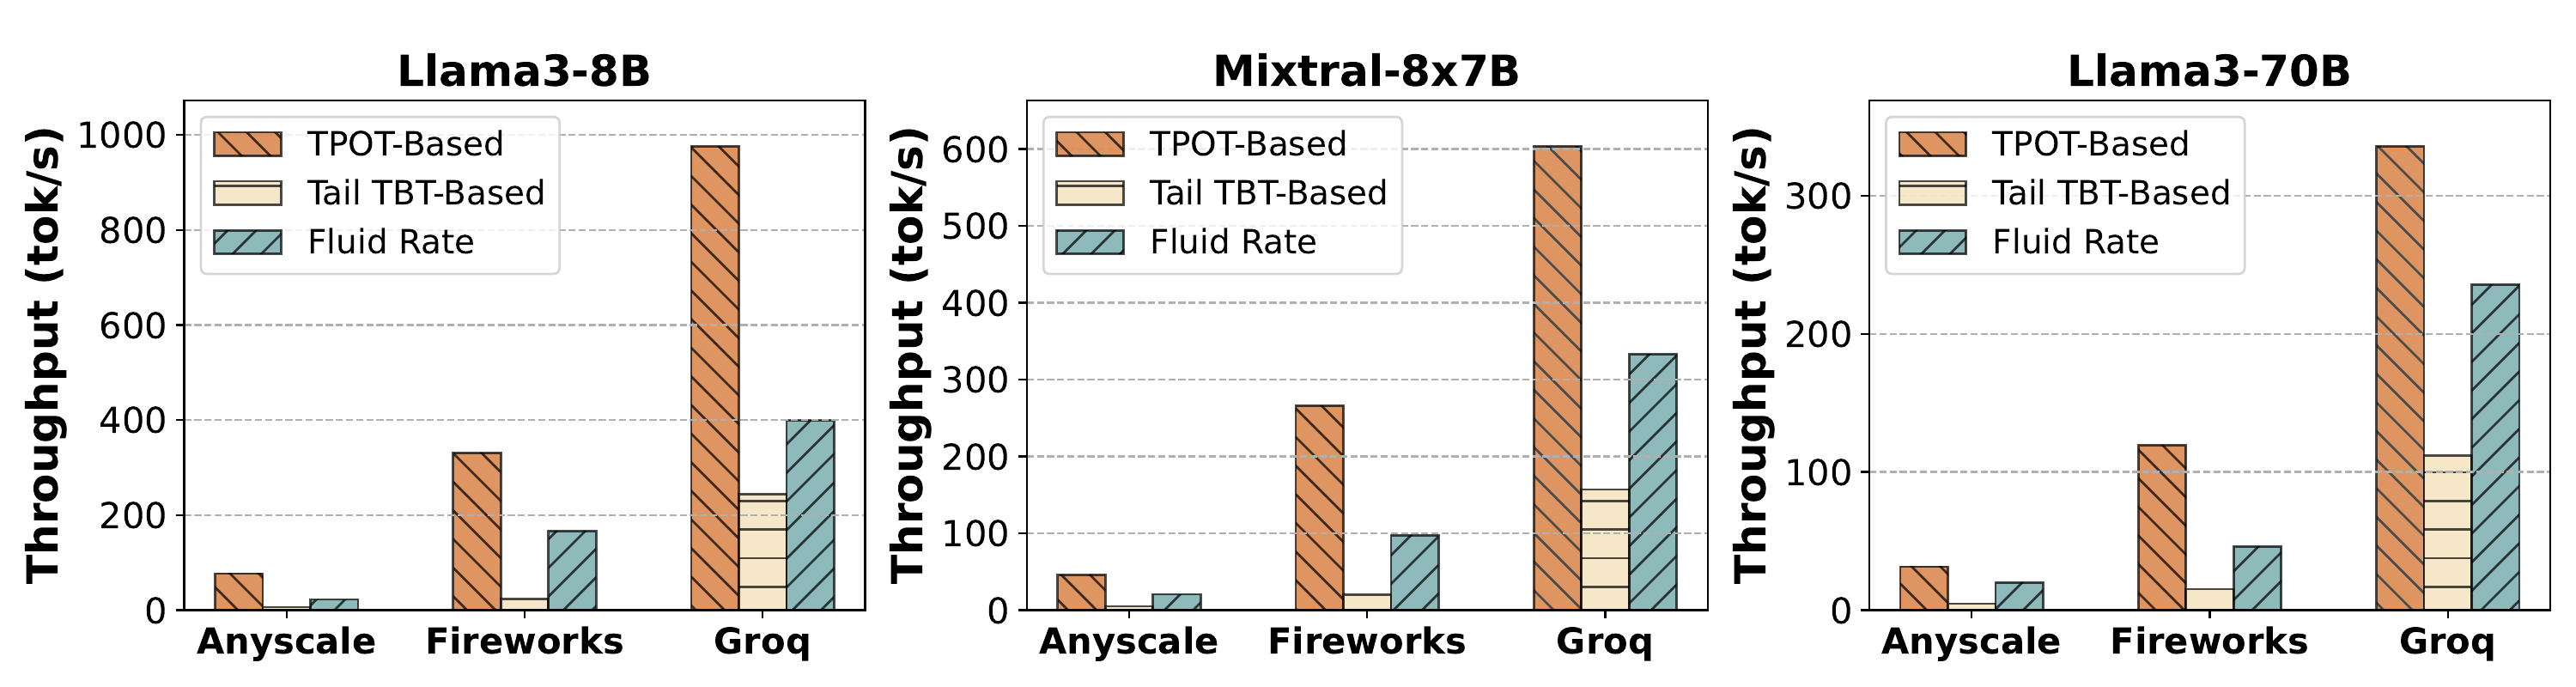
Token Rate Comparison
Above figure depicts throughput measured by etalon for different systems based on three different metrics:
TPOT
TBT
fluid-token-generation-rate: Here we find minimum TBT latency such that 99% of requests have fluidity-index at least 0.9. Inverse of TBT latency is fluid-token-generation-rate.
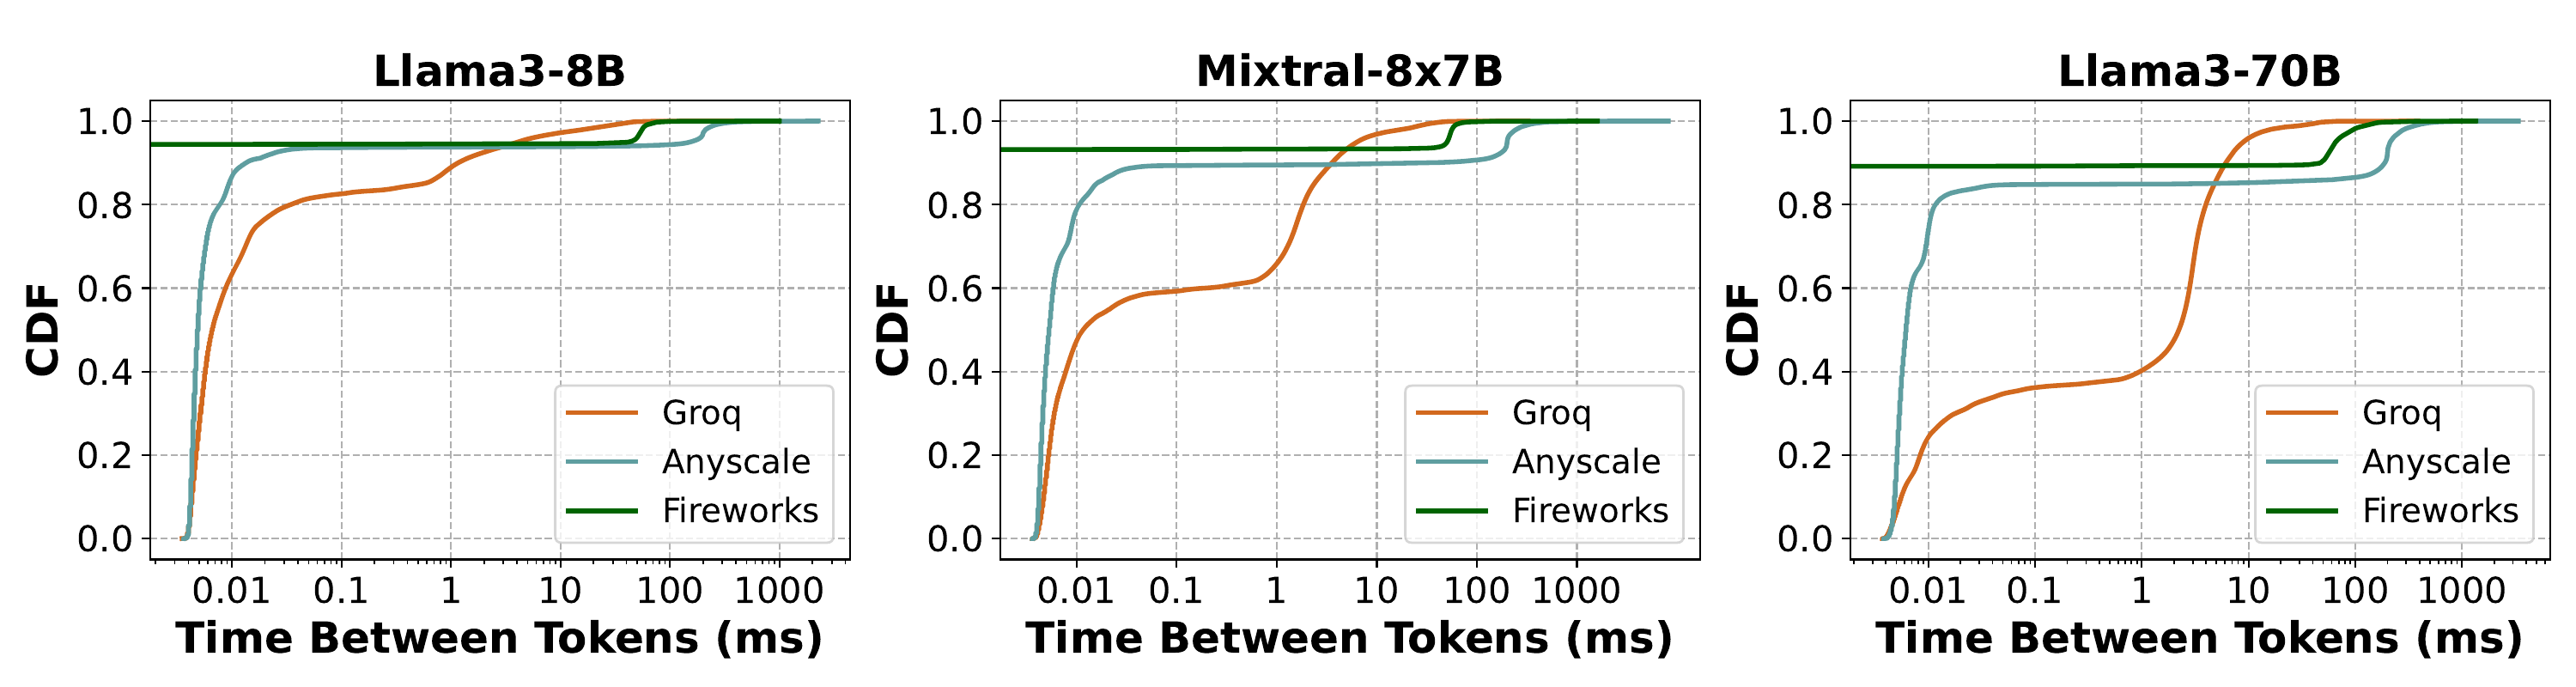
TBT CDF
Above figure depicts TBT CDF for different systems. It is difficult to interpret the difference in TBT across different systems.
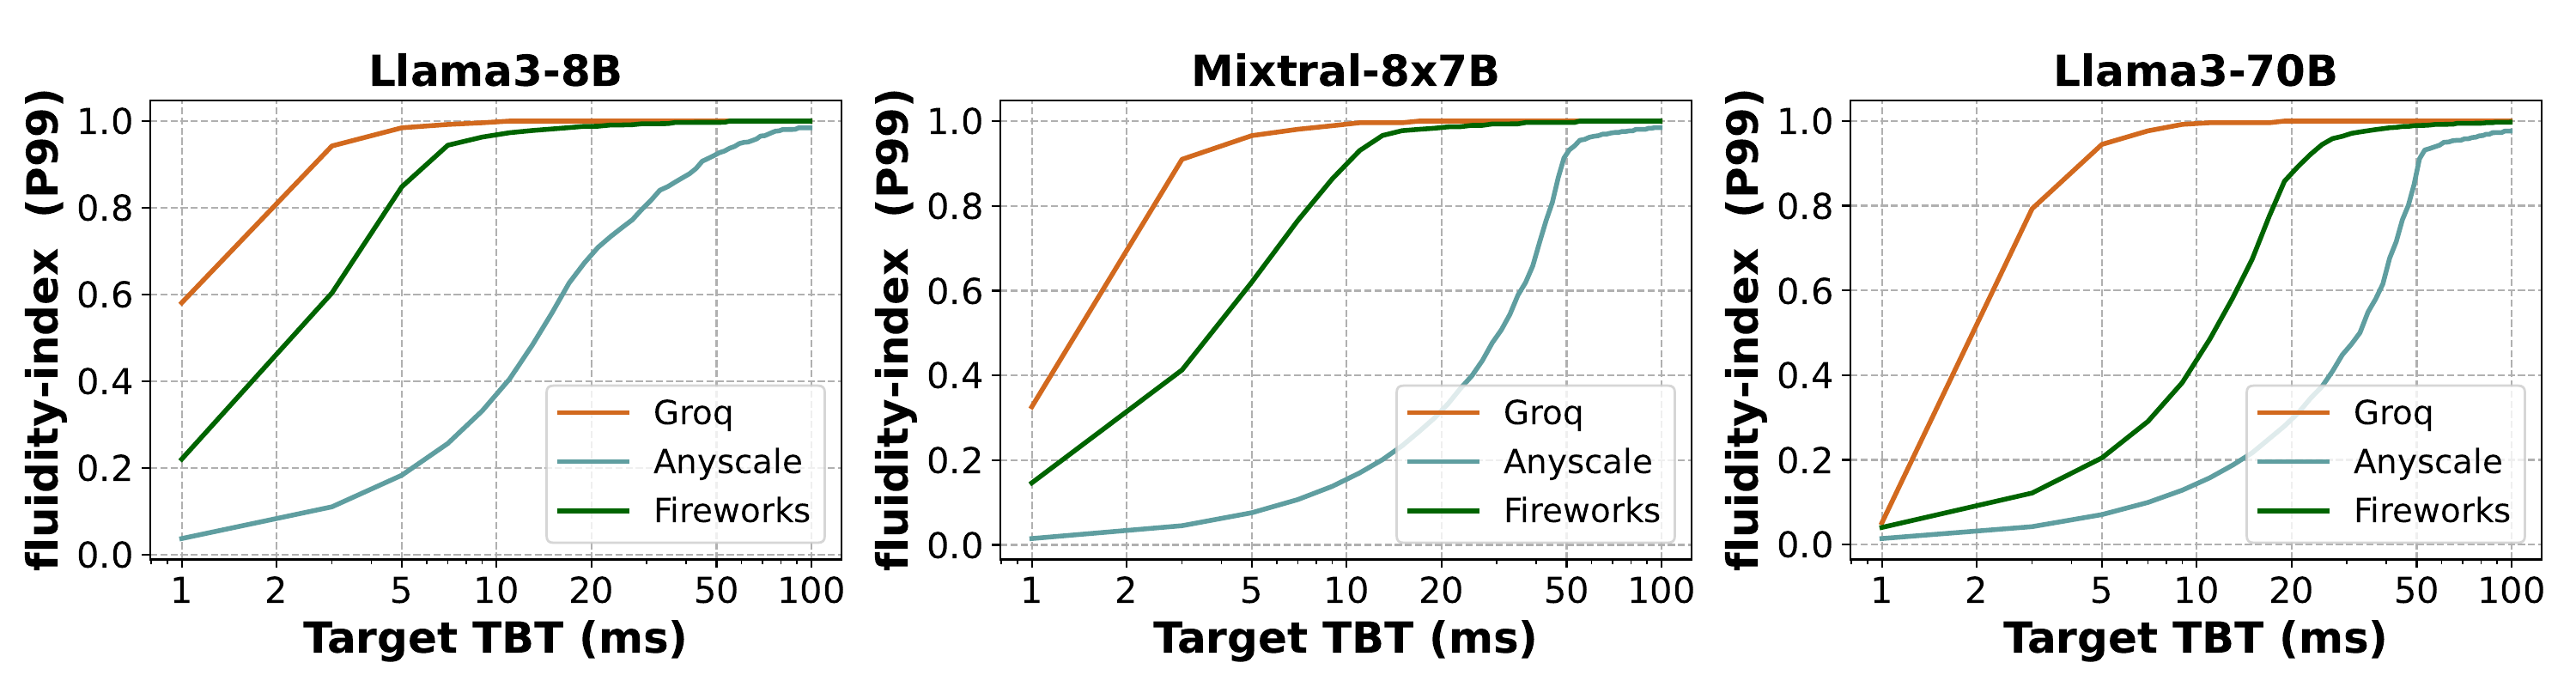
TBT Acceptance Rate Curve
Above figure clearly highlights the difference in TBT across different systems which was difficult to interpret in previous figure, TBT CDF.